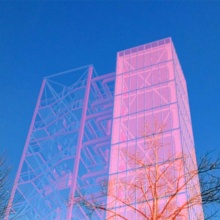
Visual comparison of a principal stress in an adaptive beam through two views with coupled camera
Image: (c) ILEK, VISUS
Visual comparison of a principal stress in a passive beam through two views with coupled camera
Image: (c) ILEK, VISUS
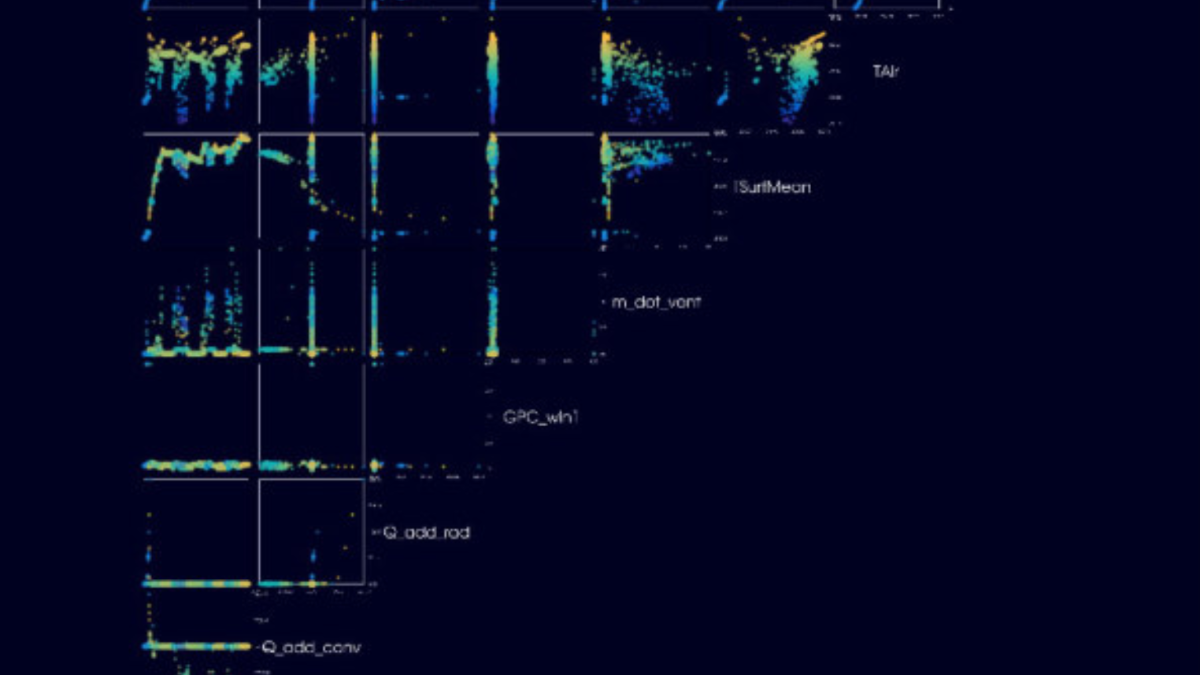
Scatterplot matrix for visualization of a simulation result of a MPC for air conditioning from subproject A05. In the coupled views, data points can be selected and filtered and the coloring can be selected according to different sizes.
Image: (c) VISUS, ISYS
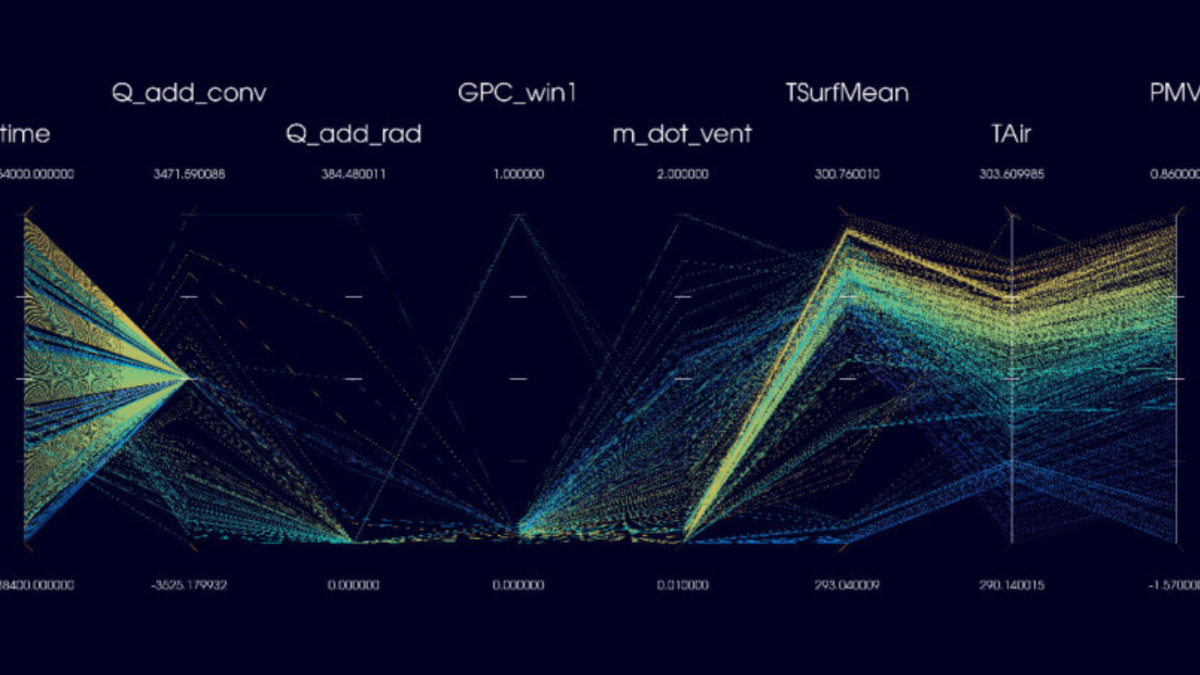
Parallel coordinates for visualization of a simulation result of a MPC for air conditioning from subproject A05. In the coupled views, data points can be selected and filtered and the coloring can be selected according to different sizes.
Image: (c) VISUS, ISYS
Funding Phase I
The research of B05 allows other projects to perform a faster analysis of generated data and gain new or better insights. This shall make the answering of questions that arise during the creation of a methodology for adaptive structures easier.
To that end, the project addresses the following research questions:
- Considering existing processes and proven metaphors, which specialised techniques are suitable for an actual or abstract visualization of adaptive structures?
- Which visualization methods are useful for the analysis of data generated by simulations and for the evaluation of designed structures?
- How can mechanical, thermal and acoustic states be visualized in a single, integrated approach? This visualization should include structural integrity, which is influenced by external elements.
- What kind of representations are suitable for a combined analysis of data both inside and on the surface of structures?
- How can the developed simulation methods be reduced?
The mechanical, thermal and acoustic states of an adaptive and lightweight structure require visualization in an integrated approach. To support a comprehensive and interactive visual analysis, the individual visualizations will be tightly coupled. In the beginning, the results of simulations are visualized using known approaches for displaying geometry meshes, as well as scalar and vector fields. To help with the analysis of simulations and the evaluation of designed structures, new techniques for the visualization of the generated data are developed.
At the same time, a suitable representation for the combined analysis of data both inside and on the surface of structures has to be found. In order to manage large amounts of varieties and high-dimensional parameter spaces, new individual approaches, as well as combinations of these approaches, will be investigated. For a fast and comprehensive evaluation of variations of the physical elements of a building as well as different simulation methods, concepts for comparative visualizations have to be developed.
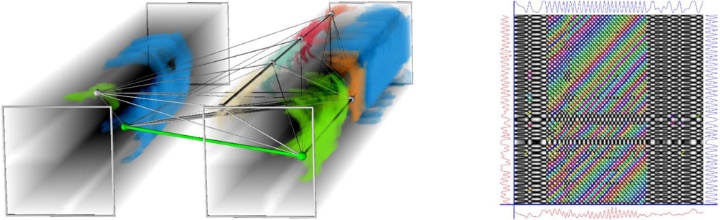
 Photo: VISUS
The development of such methods is based on the current state of the art of rendering and visualization. Additionally, to run the resulting tools and applications on less powerful workstations, simplifications of the methods for the visual analysis will be investigated.
Project B05 supplies the other projects with methods for interactive, visual analysis of their models and results, helping them to present, understand and validate their findings.
Subproject Leader
- Prof. Dr. rer. nat. Dr. techn. h.c. Dr.-Ing. E.h. Thomas Ertl, Institute for Visualisation and Interactive Systems (VIS)
- Dr. rer. nat. Guido Reina, Visualisation Research Centre
Funding Phase II
Data analysis in the SFB 1244 involves two fundamental challenges: On the one hand, adaptive structures and shells are the subject of research and can be parameterized topologically and geometrically in many respects.
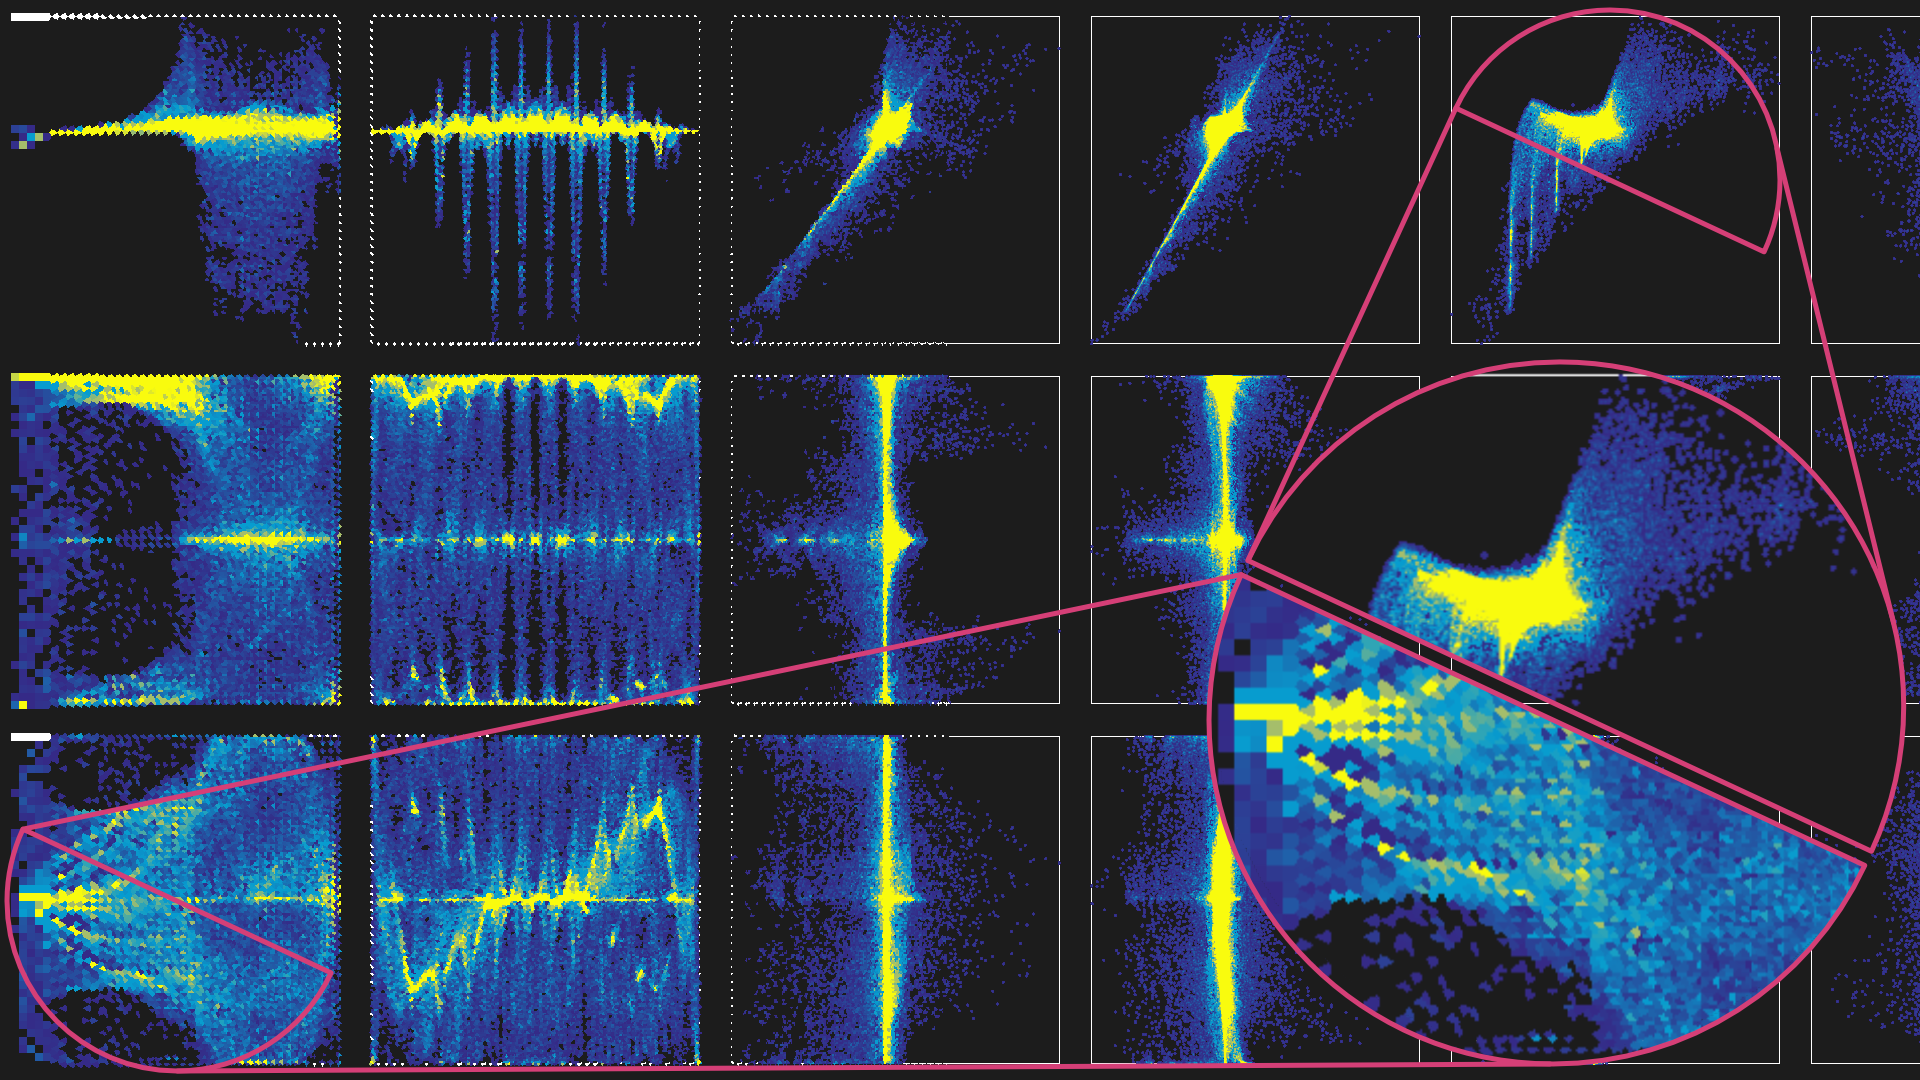 Our method for accelerating 2D visualizations using dynamic resolution scaling and temporal reconstruction. New regions entering the image are only rendered at low resolution as no previous image information is available, while regions visible in previous frames can retain full image quality. Source: VISUS
It is therefore necessary to facilitate the understanding of this high-dimensional and complex data for the researchers of the other subprojects, both on an abstract level and in the physical context.
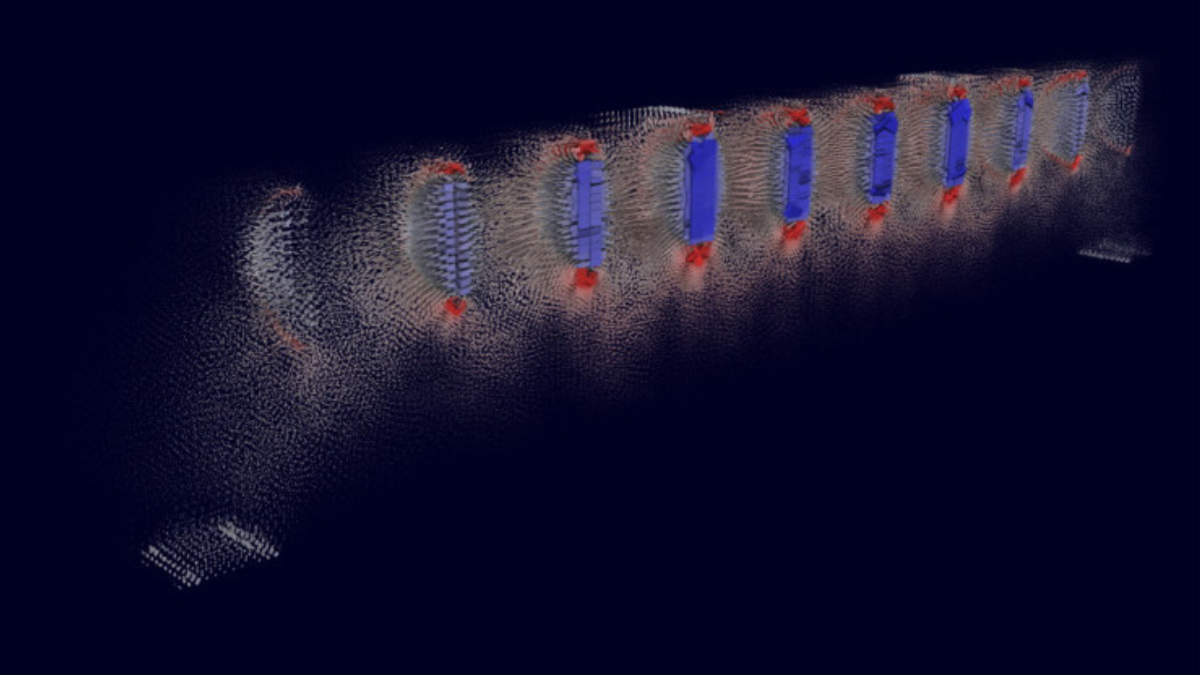
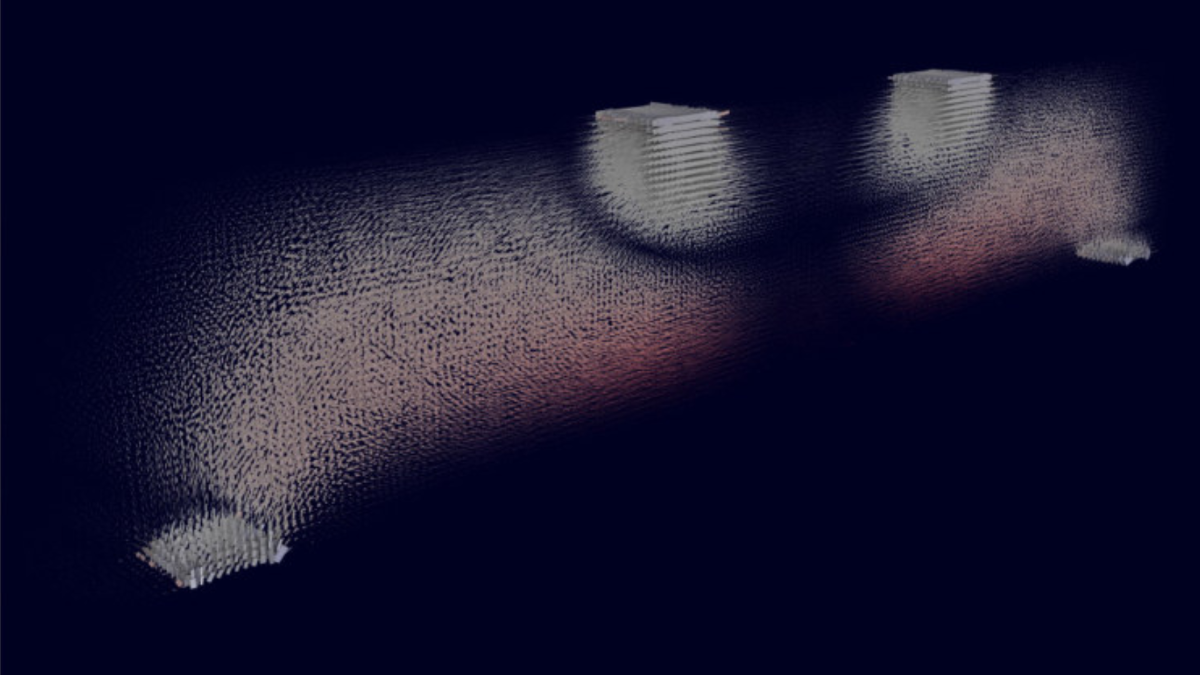
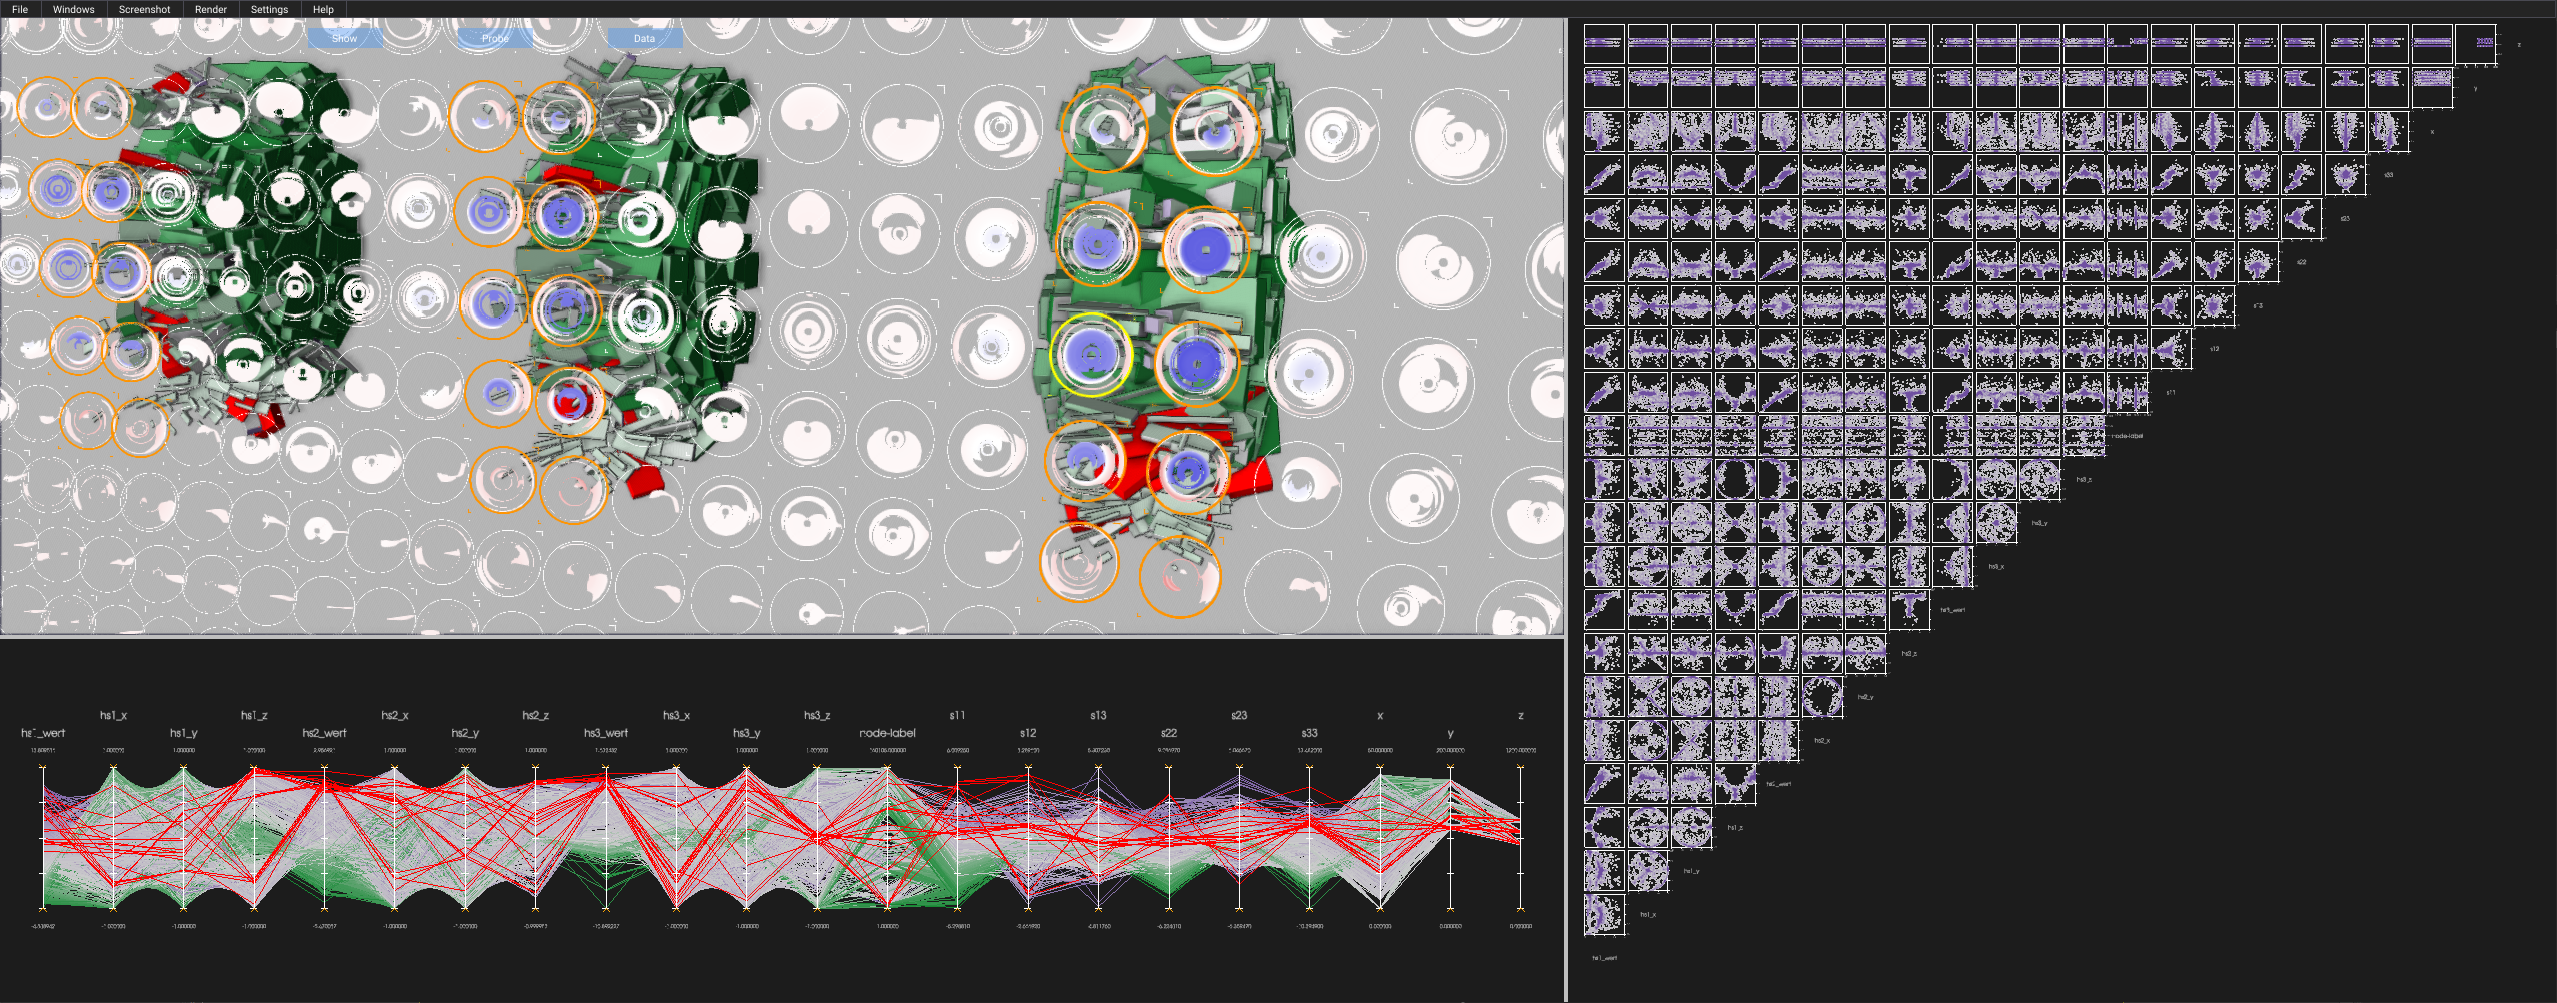 Linked-view visualization that combines our probe glyphs with 3D box glyphs, a parallel coordinates plot, and a scatter plot matrix. A probe-based selection is used to filter the data set to reveal regions of interest in the 3D view that were identified from the probe glyphs before. Filtering and selection is also linked to the 2D views. Source: VISUS
This requires new visualization techniques that enable a comparison of different variants and an understanding of the differences. On the other hand, the visualization approaches must work effectively in the context of the demonstrator high-rise building.
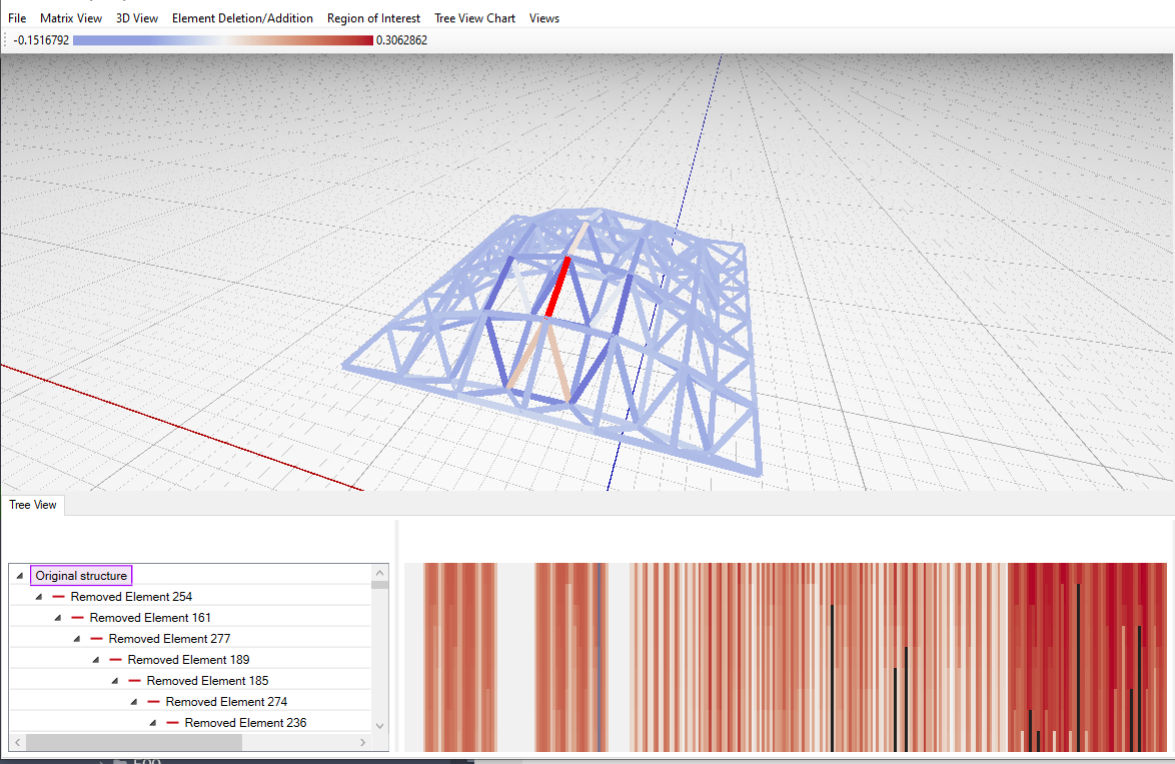 Visual analytics application for truss structure redundancy matrices. It allows to explore a tree within a structure’s design space that is populated by element deletion and addition operations. Views include a 3D view and matrix plot (top), and a hierarchical list of the tree nodes with different redundancy matrix distribution plots (bottom). Source: VISUS
Practical experience shows that both the planning and the sensor data and their effect on the control technology used must be made available to the researchers on site in order to ensure a more efficient workflow. Augmented reality (AR) plays a central role here, allowing relevant data to be visualized and analysed directly in the context of the demonstrator's real environment. The visualization and presentation of sensor data must take place in real time.
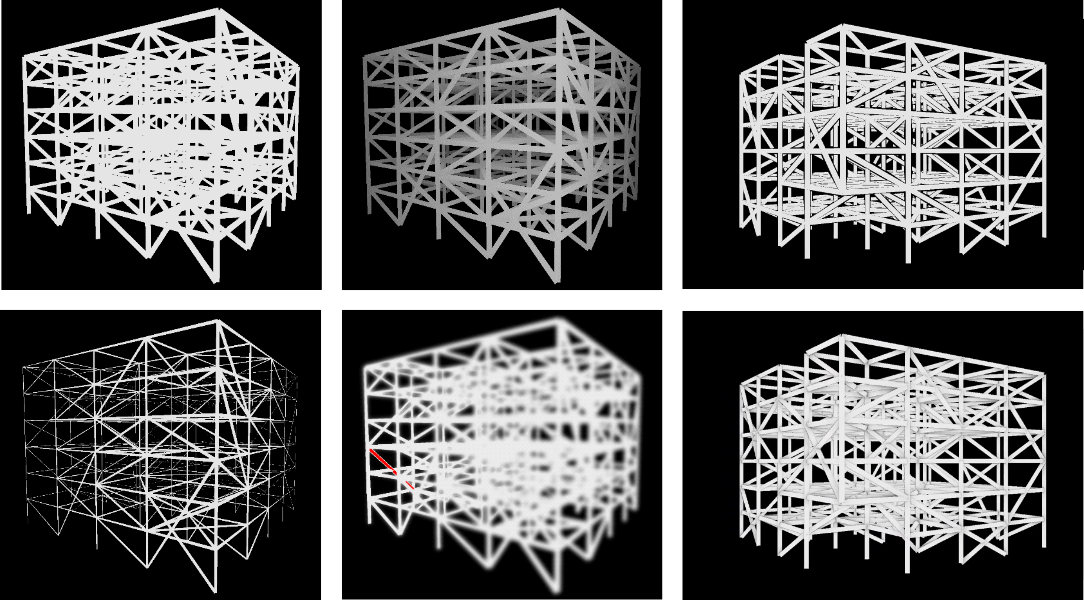 Multiple options for improving depth perception of a truss structure (left to right, top to bottom: base rendering, brightness attenuation, depth halos, line thickness, defocus, ambient occlusion). Source: VISUS
The sub-project will partly continue the research from the first funding period in order to ensure continuity in the development of the required visualization methods. Due to the more complex simulations compared to the first funding period and the comprehensive sensor technology, significantly larger amounts of data will be generated. The extension of research to include building envelopes will not only result in growing data volumes, but also in a more complex structure of the buildings to be visualized, in particular due to greater occlusion problems and even more complex interactions between the components under investigation.
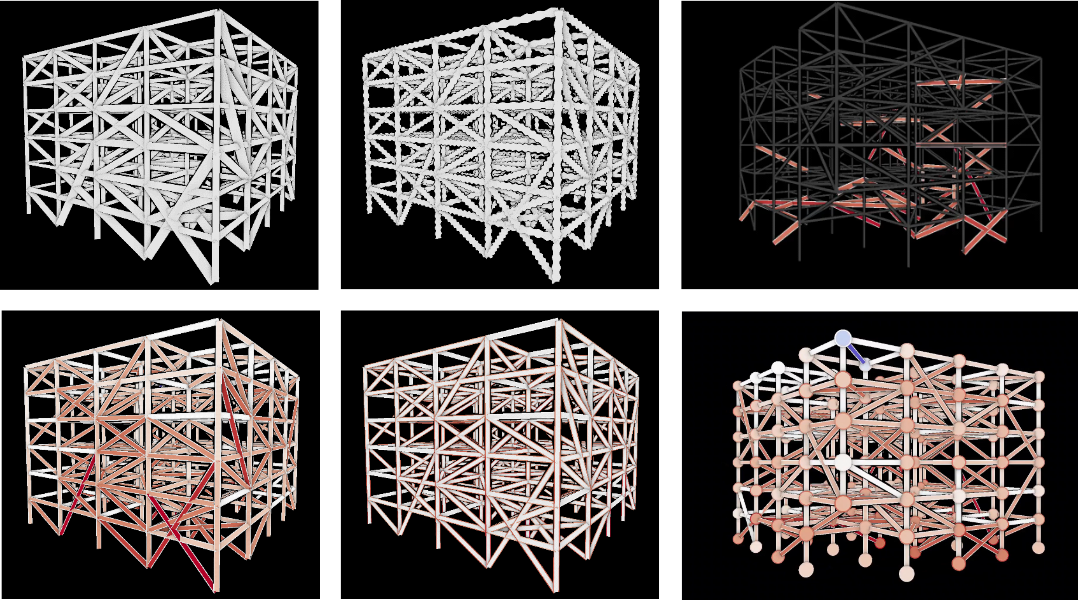 Various options for multi-attribute visualizations on the elements or nodes of a truss structure (left to right, top to bottom: line thickness, line shape, filtered lines, line fill color, line stroke color, node size, and color). Source: VISUS
Despite this scalability problem, the visualization must enable an intuitive understanding of the properties of an adaptive building and its specific characteristics. In the absence of an established design and planning methodology for adaptive buildings, it must also be possible to compare different characteristics.
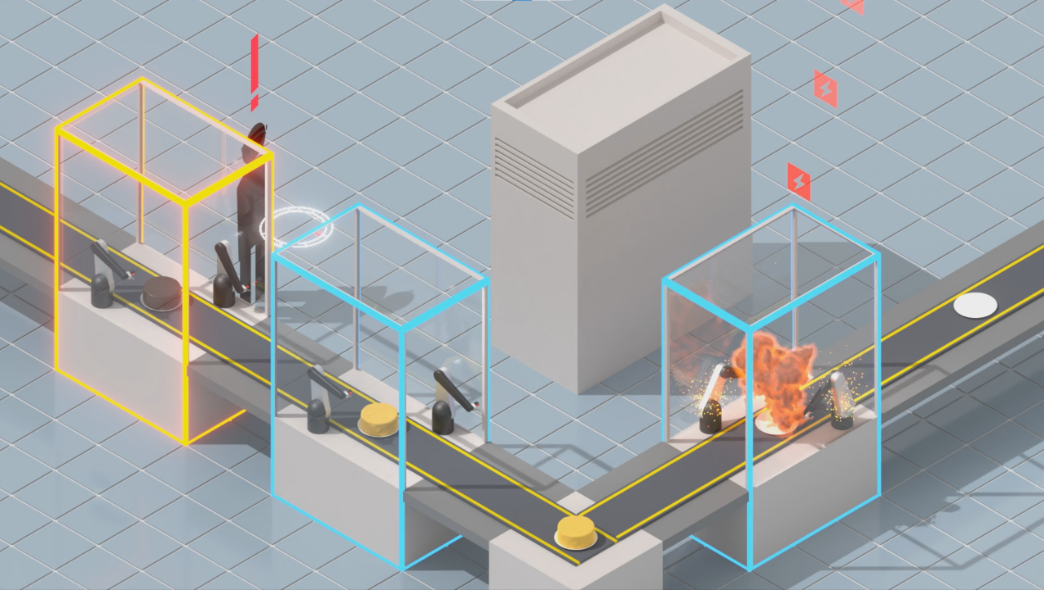
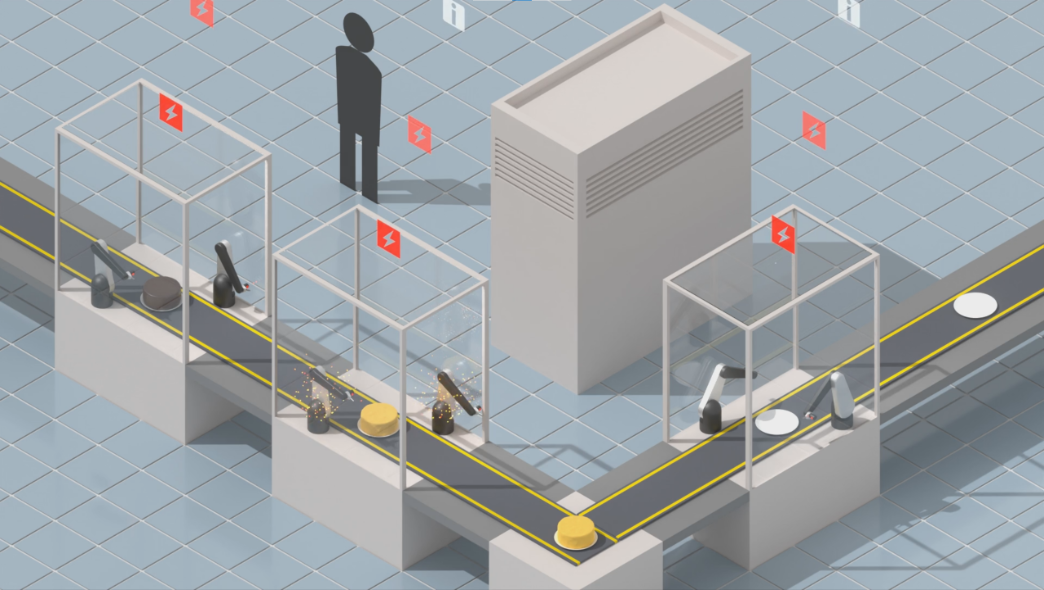 Modern, sensory-equipped machines, here in the context of an automated production line, continuously produce data in real-time about their progress and important events, e.g., malfunctions. Source: VISUS
One research objective is the development of interaction and visualization techniques for on-site analysis. This requires progress in terms of interaction types, spatial localization and scalable algorithms for the rather underpowered mobile AR hardware. In addition, familiar visualization techniques cannot be transferred directly to AR applications. Corresponding adaptations for situated visualization must take into account the context of the real environment as well as the interaction between virtual data content and the real environment.
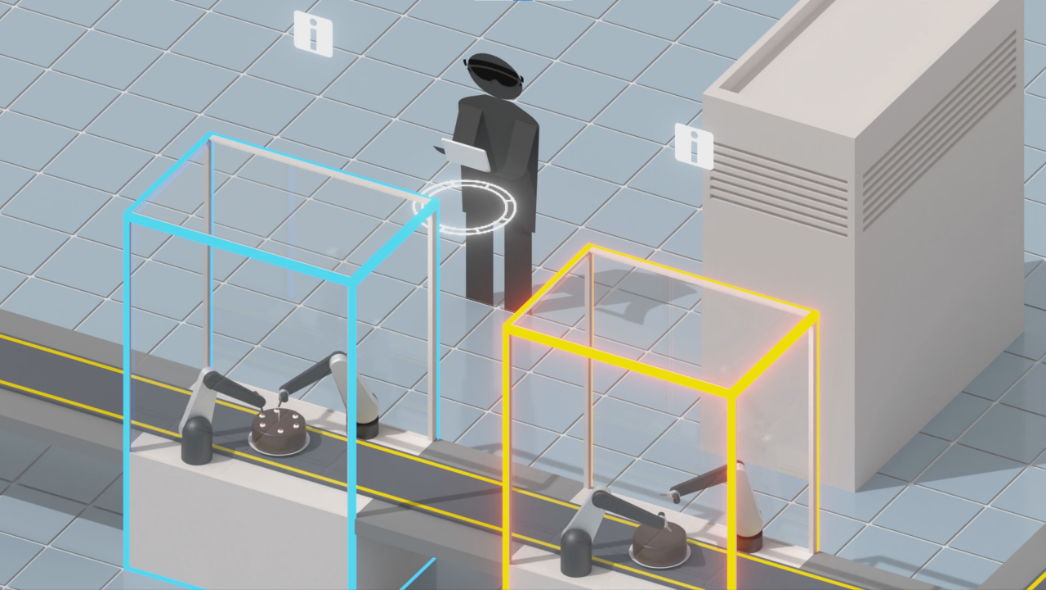 The task of on-site operators has shifted toward monitoring machines and identifying and resolving malfunctions as fast as possible. To support these tasks, our approach provides real-time monitoring and on-site visual analysis using a tablet computer and an AR HMD: The AR view highlights individual machines and provides timely notifications and spatial guidance about malfunction events in a virtual compass. Source: VISUS
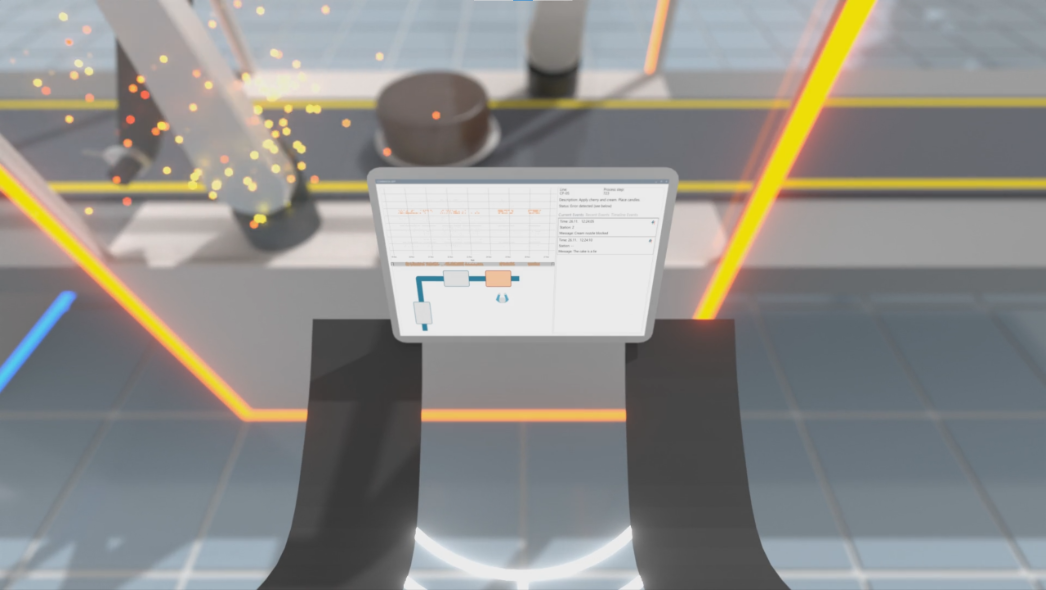 The tablet computer provides details about malfunctions and historical data to inform users during the repair process. Source: VISUS
 Via the AR view, new malfunction events that occur outside an operator’s field of view can be immediately noticed. Source: VISUS
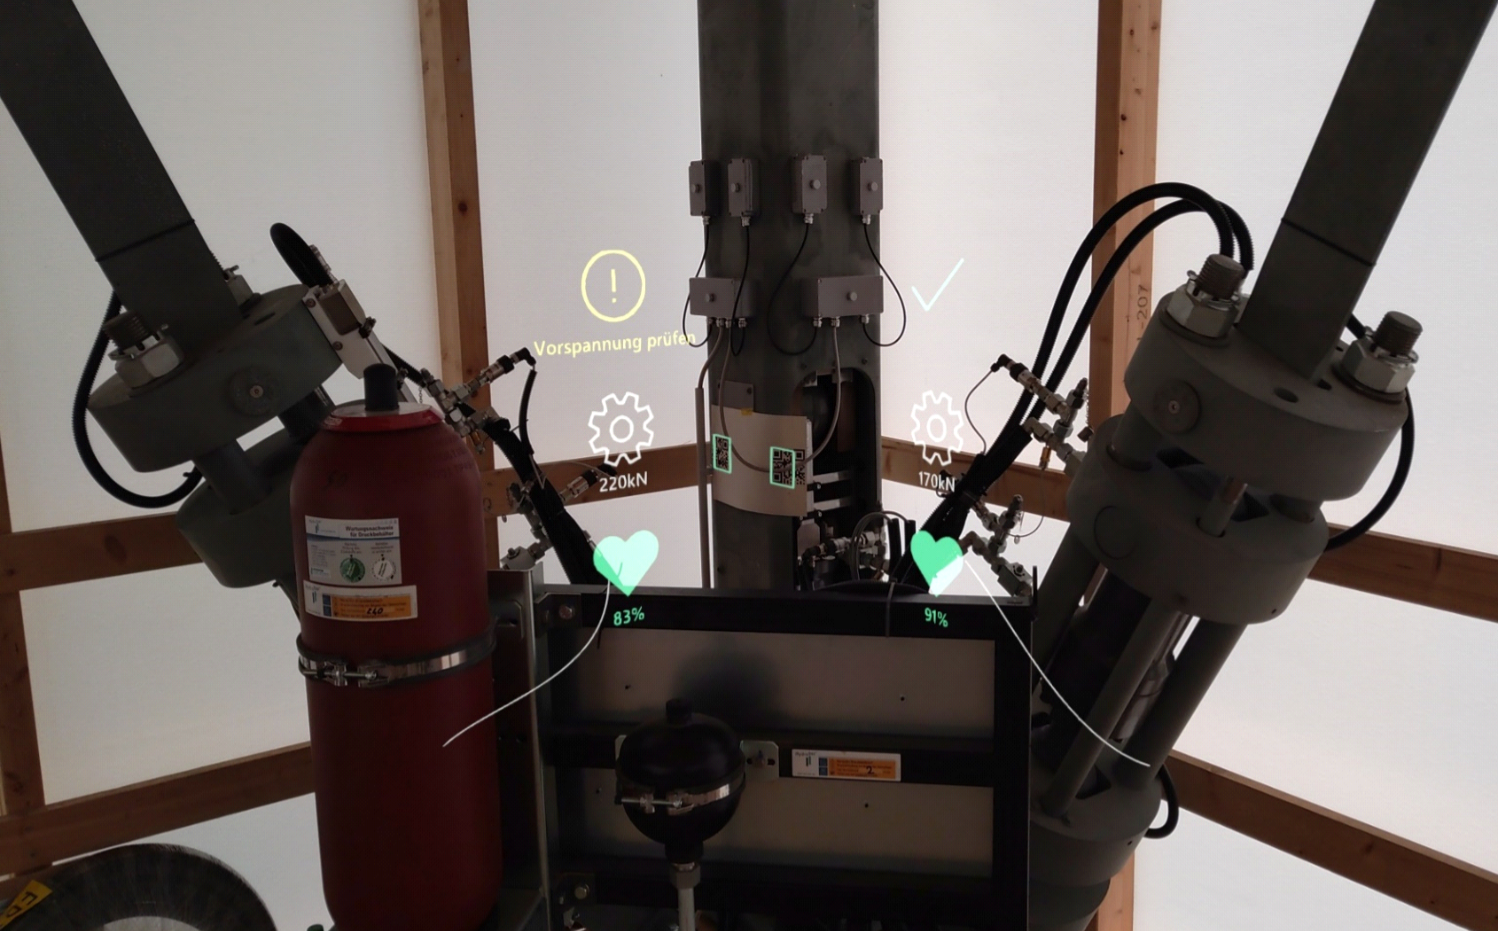
 AR view captured from the HMD. Minimalistic situated visualizations are placed at and visually linked to referents in the real world. Source: VISUS
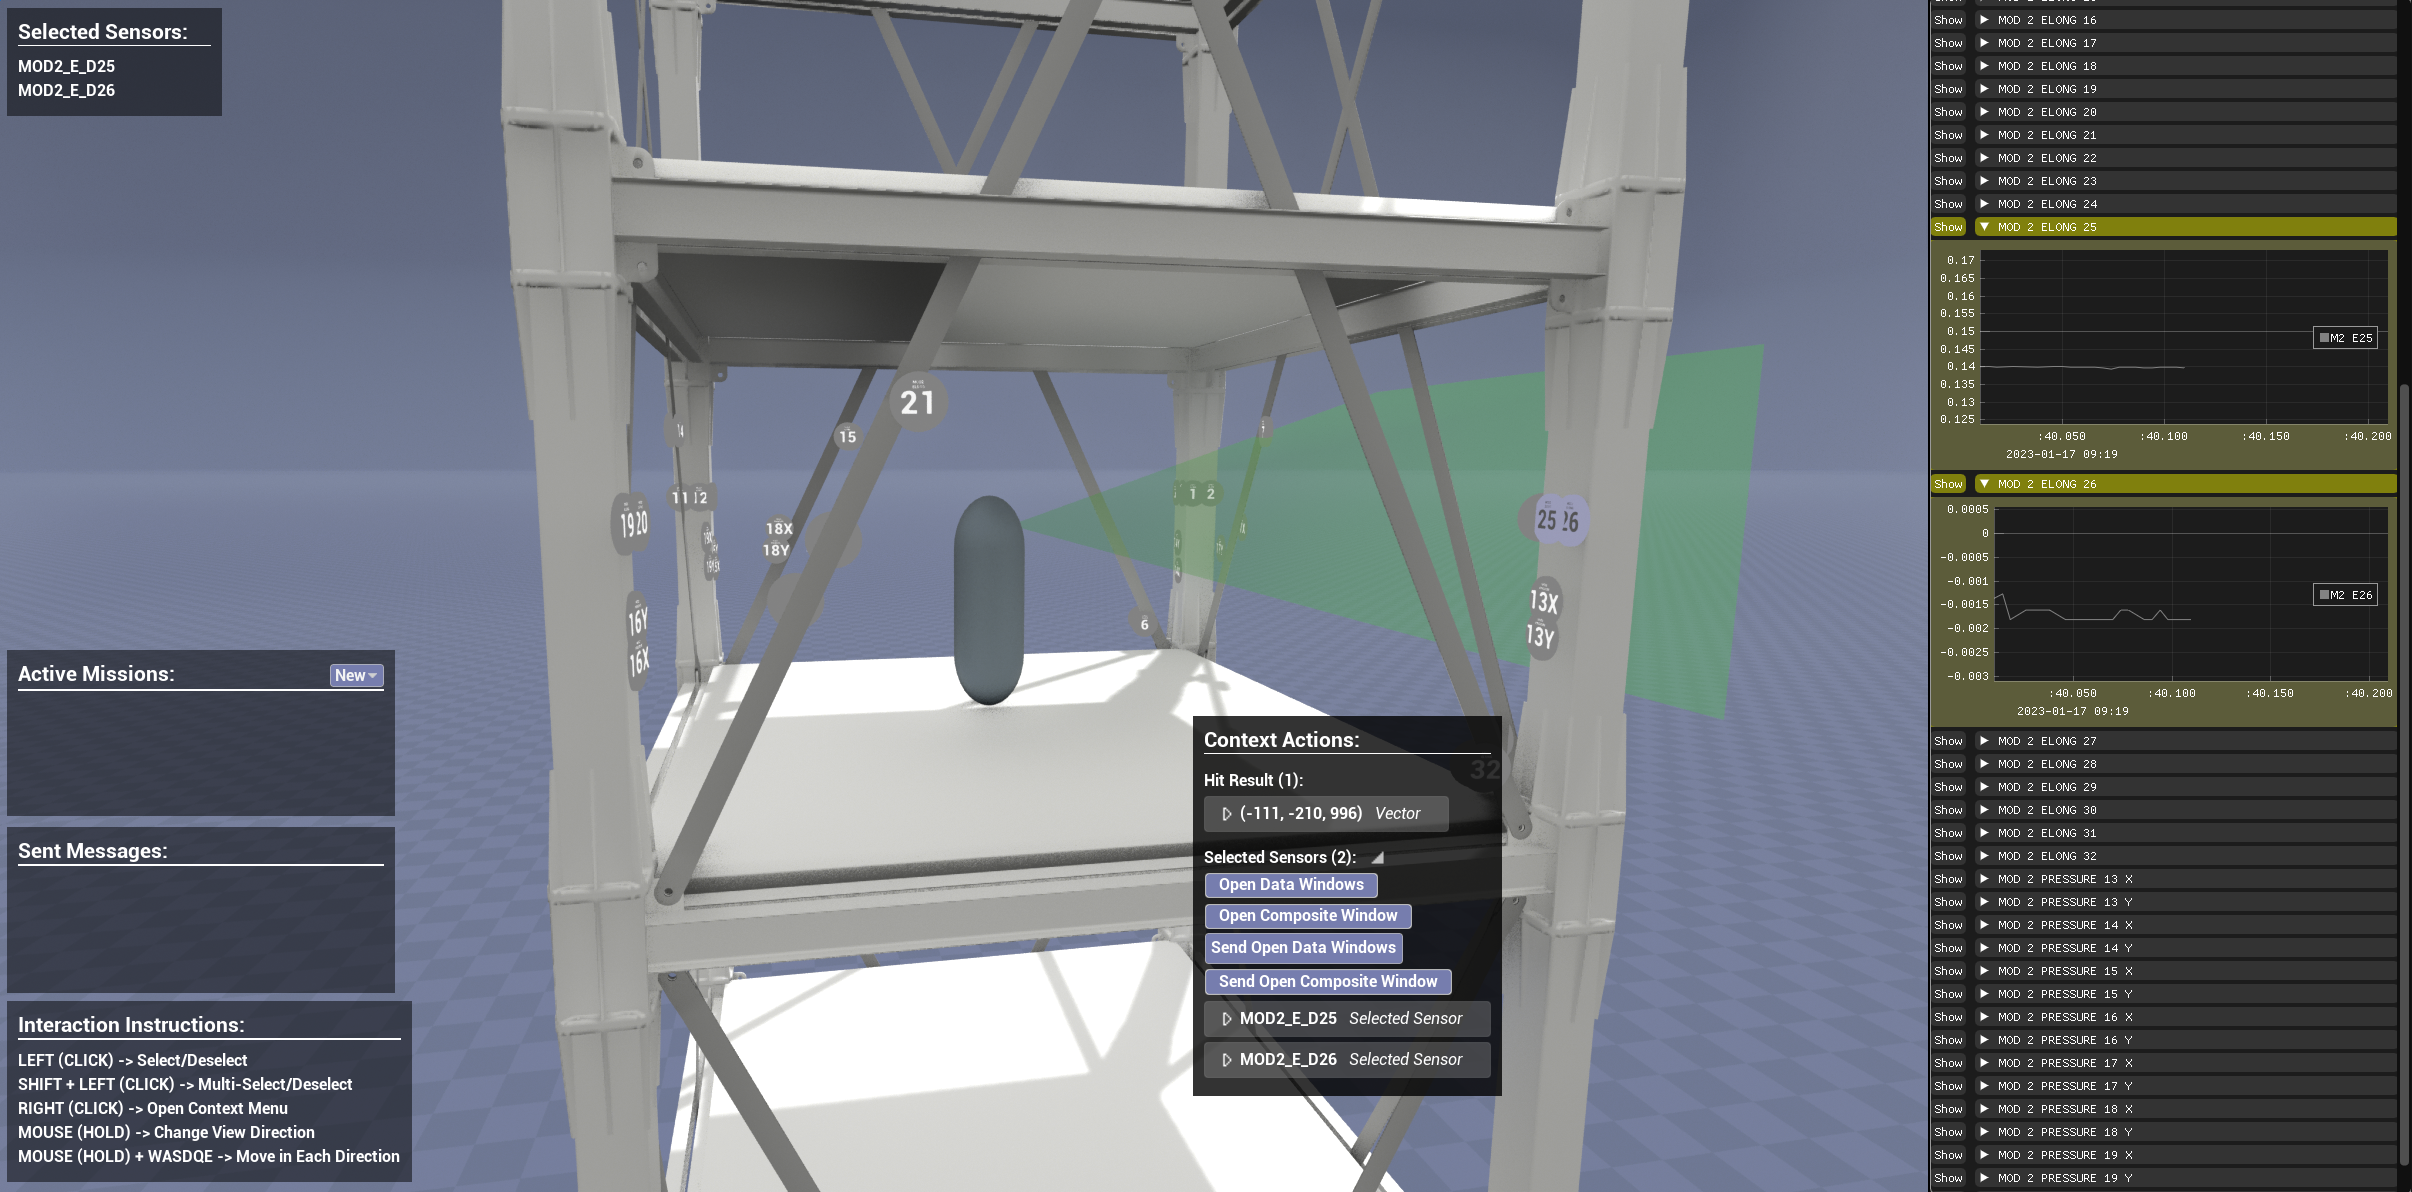
 A desktop-based application provides an overview of D1244’s live sensor data. Plots are presented in a list or embedded into the 3D view at the location of sensors in the building. The activity of on-site HoloLens users is shared, and instructions can be exchanged using an asymmetric collaboration approach. Source: VISUS
Contact

Michael Becher
M.Sc.Doctoral Researcher